Note
Go to the end to download the full example code.
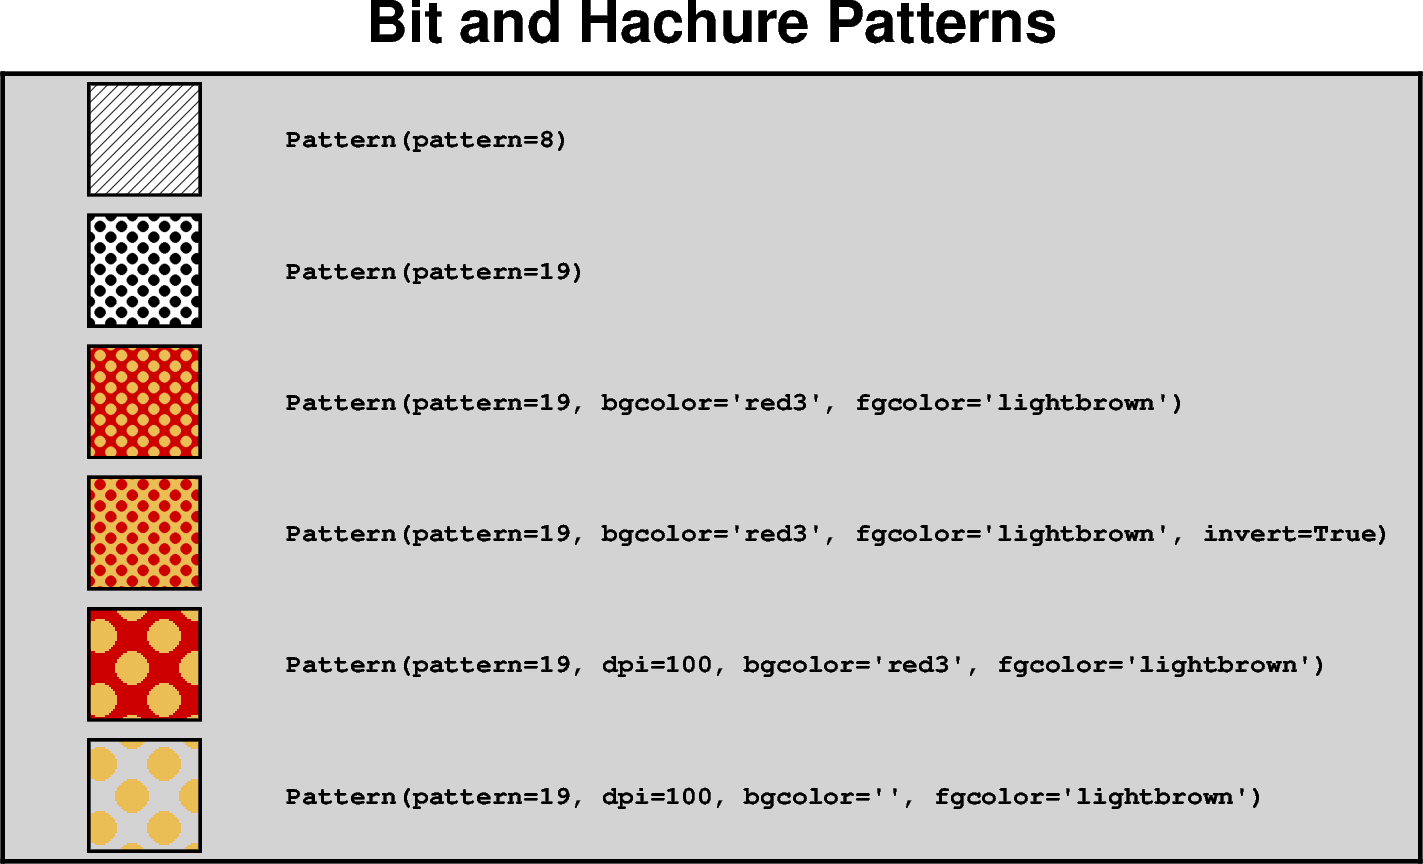
Bit and hachure patterns
In addition to colors, PyGMT also allows using bit and hachure patterns to fill symbols,
polygons, and other areas, via the fill parameter or similar parameters.
Example method parameters that support bit and hachure patterns include:
pygmt.Figure.coast: Land and water masses vialandandwaterpygmt.Figure.histogram: Histogram bars viafillpygmt.Figure.meca: Focal mechanisms viacompressionfillandextensionfillpygmt.Figure.plot: Symbols and polygons viafillpygmt.Figure.rose: Histogram sectors viafillpygmt.Figure.solar: Day-light terminators viafillpygmt.Figure.ternary: Symbols viafillpygmt.Figure.velo: Uncertainty wedges and velocity error ellipses viauncertaintyfillpygmt.Figure.wiggle: Anomalies viafillpositiveandfillnegative
GMT provides 90 predefined 1-bit patterns, which are numbered from 1 to 90. In addition, custom 1-, 8-, or 24-bit image raster files can also be used as patterns.
These patterns can be specified via the pygmt.params.Pattern class. The
patterns can be customized with different resolution and different foreground and
background colors. The foreground and background colors can also be inverted.
import pygmt
from pygmt.params import Pattern

# A list of patterns that will be demonstrated.
# By default, a pattern is plotted in black and white with a resolution of 300 dpi.
patterns = [
    # Predefined 1-bit pattern 8.
    Pattern(8),
    # Predefined 1-bit pattern 19.
    Pattern(19),
    # Pattern 19 with custom background ("red3") and foreground ("lightbrown").
    Pattern(19, bgcolor="red3", fgcolor="lightbrown"),
    # Invert the background and foreground.
    Pattern(19, invert=True, bgcolor="red3", fgcolor="lightbrown"),
    # Same as above, but with a 100 dpi resolution.
    Pattern(19, bgcolor="red3", fgcolor="lightbrown", dpi=100),
    # Same as above, but with a transparent background by setting bgcolor to "".
    Pattern(19, bgcolor="", fgcolor="lightbrown", dpi=100),
]

fig = pygmt.Figure()
fig.basemap(
    region=[0, 10, 0, 12],
    projection="X18c/10c",
    frame="rlbt+glightgray+tBit and Hachure Patterns",
)
y = 11
for pattern in patterns:
    # Plot a square with the pattern as fill.
    # The square has a size of 2 centimeters with a 1 point thick, black outline.
    fig.plot(x=1, y=y, style="s2c", pen="1p,black", fill=pattern)
    # Add a description of the pattern.
    fig.text(x=2, y=y, text=str(repr(pattern)), font="Courier-Bold", justify="ML")
    y -= 2
fig.show()
Total running time of the script: (0 minutes 0.203 seconds)