Note
Go to the end to download the full example code.
Configuring PyGMT defaults
Default GMT parameters can be set globally or locally using pygmt.config.
import pygmt
Configuring default GMT parameters
Users can override default parameters either temporarily (locally) or permanently
(globally) using pygmt.config. The full list of default parameters that can
be changed can be found at https://docs.generic-mapping-tools.org/6.5/gmt.conf.html.
We demonstrate the usage of pygmt.config by configuring a map plot.
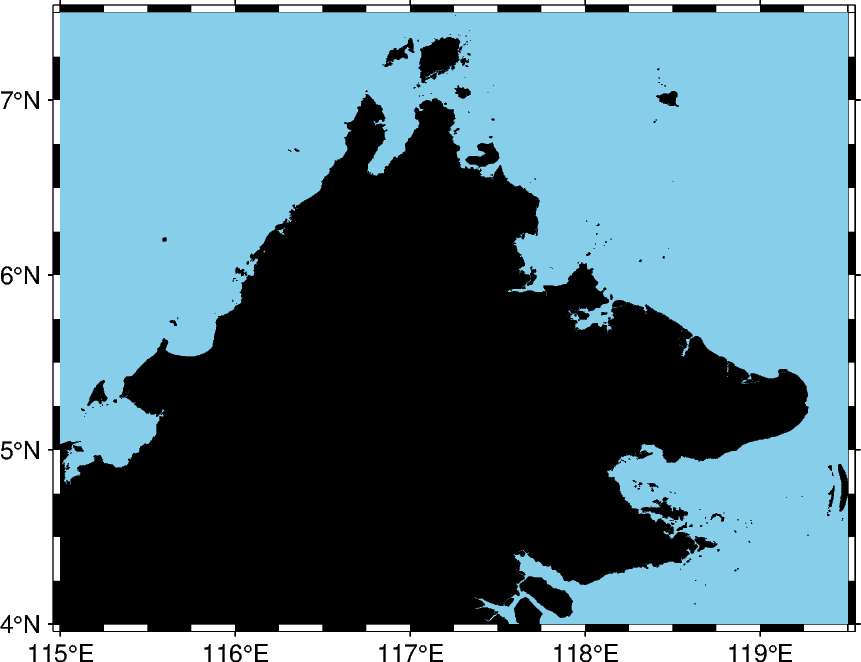
# Start with a basic figure with the default style
fig = pygmt.Figure()
fig.basemap(region=[115, 119.5, 4, 7.5], projection="M10c", frame=True)
fig.coast(land="black", water="skyblue")

fig.show()
Globally overriding defaults
The MAP_FRAME_TYPE parameter specifies the style of map frame to use, of which
there are 5 options: fancy (default, see above), fancy+, plain, graph
(which does not apply to geographical maps) and inside.
The FORMAT_GEO_MAP parameter controls the format of geographical tick annotations.
The default uses degrees and minutes. Here we specify the ticks to be a decimal number
of degrees.
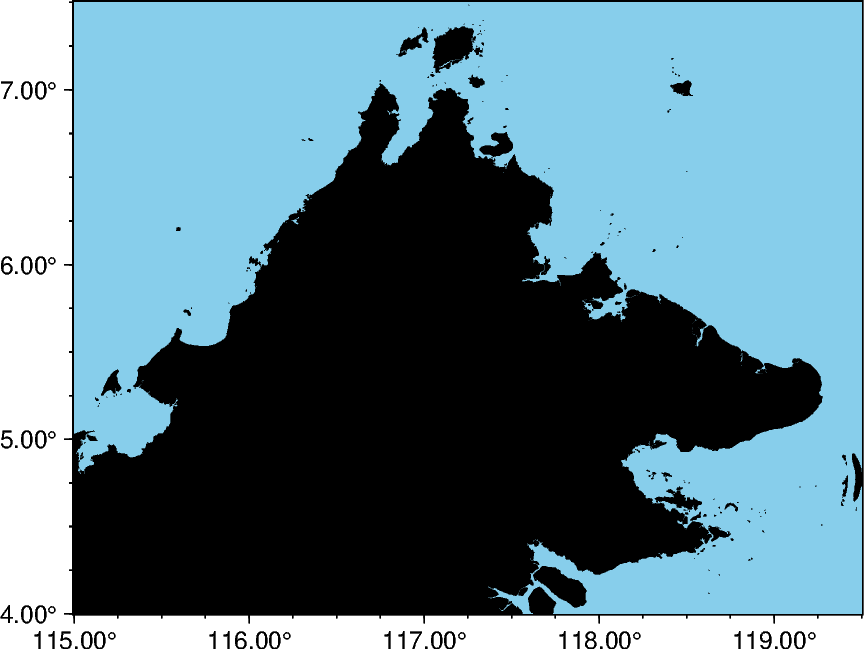
fig = pygmt.Figure()

# Configuration for the 'current figure'
pygmt.config(MAP_FRAME_TYPE="plain")
pygmt.config(FORMAT_GEO_MAP="ddd.xx")

fig.basemap(region=[115, 119.5, 4, 7.5], projection="M10c", frame=True)
fig.coast(land="black", water="skyblue")

fig.show()
Locally overriding defaults
It is also possible to temporarily override the default parameters, which is very
useful for limiting the scope of changes to a particular plot. pygmt.config
is implemented as a context manager, which handles the setup and teardown of a GMT
session. Python users are likely familiar with the with open(...) as file:
snippet, which returns a file context manager. In this way, it can be used to
override a parameter for a single command, or a sequence of commands. An application
of pygmt.config as a context manager is shown below:
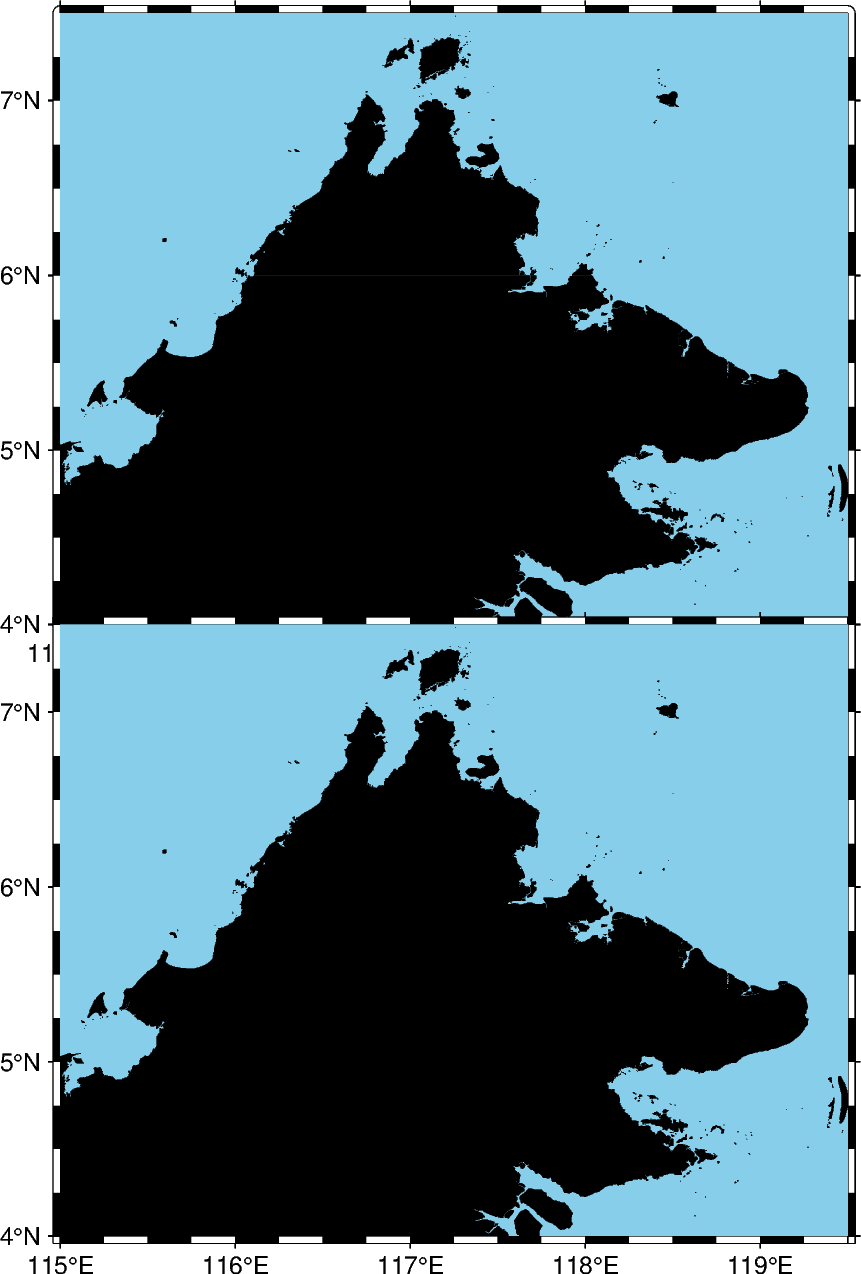
fig = pygmt.Figure()

# This will have a fancy+ frame
with pygmt.config(MAP_FRAME_TYPE="fancy+"):
    fig.basemap(region=[115, 119.5, 4, 7.5], projection="M10c", frame=True)
fig.coast(land="black", water="skyblue")

# Shift plot origin down by the height of the figure to plot another map
fig.shift_origin(yshift="-h")

# This figure retains the default "fancy" frame
fig.basemap(region=[115, 119.5, 4, 7.5], projection="M10c", frame=True)
fig.coast(land="black", water="skyblue")

fig.show()
Total running time of the script: (0 minutes 0.448 seconds)